This guide walks you through TransitLens step by step: from loading your first GTFS feed to filtering stops and routes, using the Inspector, and analyzing transit networks. If you're new to GTFS data, to TransitLens as a GTFS viewer, or to map-based transit exploration, start here.
Load your first GTFS feed
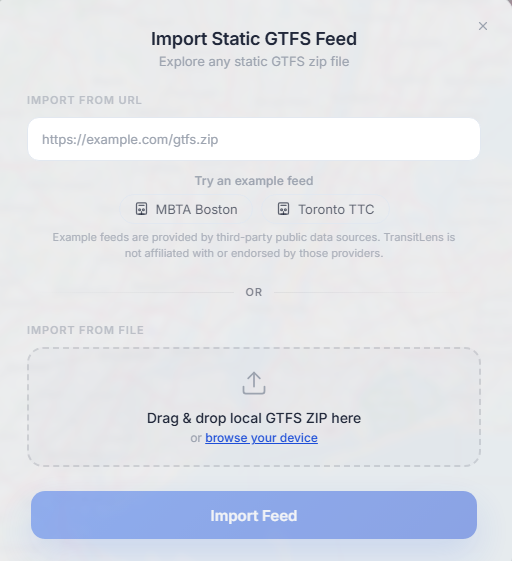
Open TransitLens and import a GTFS feed. You can upload a .zip file from your computer or paste a URL to a publicly hosted feed. Most transit agencies publish their GTFS feeds on their open data portals.
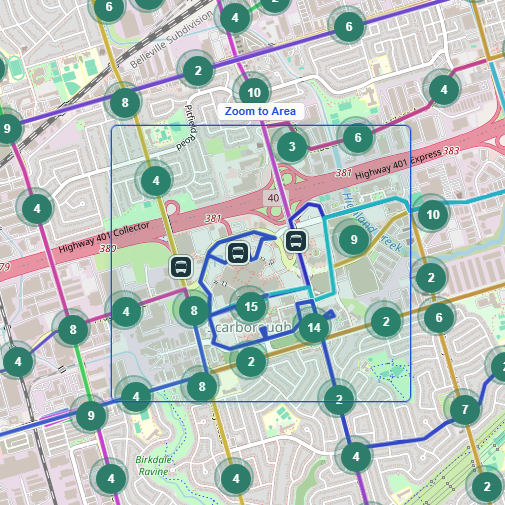
Once the feed loads, TransitLens parses every file in the archive, including routes, trips, stops, calendars, and shapes, and renders the entire network on an interactive map. The map automatically zooms and pans to fit the geographic extent of the feed, so you immediately see the full transit network.
Loading time depends on the feed size and complexity. Standard feeds usually complete within a few seconds, while large feeds with thousands of routes and stops can take several minutes.
Open a feed directly from a URL
You can also skip the import step entirely by using a direct link. Paste a publicly hosted GTFS feed URL below to generate a shareable link that opens it directly in TransitLens:
Try with a sample feed. Sample: MBTA data under the MassDOT Developers License Agreement. Data licensing
This is useful for sharing feeds with teammates or bookmarking datasets you work with frequently.
Navigate the map
Once your feed is loaded, you can explore the map using standard controls:
Shift and dragging- Pan: click and drag to move around the map
- Zoom in/out: use your mouse scroll wheel or the
+/-buttons on the map or your keyboard, double-click to zoom in, or holdShiftand double-click to zoom out - Zoom to area: press and hold
Shiftand drag your mouse to select an area to zoom
As you zoom in, individual stops become visible and route lines gain more detail. Zoom out to see the big picture: how the network covers its service area.
Explore routes and stops
TransitLens gives you several ways to explore what's in the feed:
- Click a route on the map: the route highlights and its info card opens, showing the route name and type. Press on "View in Inspector" to focus on a specific route in the Inspector side panel.
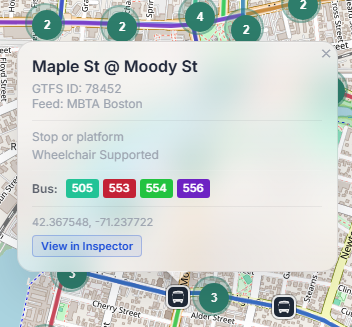
- Click a stop: see which routes serve that stop, click on "View in Inspector" to view this stop metadata in the Inspector side panel, or select one of the routes to focus on this route in Inspector.
- Use the top search bar: to search for a route or a stop by number or name, search for locations and addresses on the map.
Route info cards display key information at a glance: the route short name, long name, transit mode (bus, rail, tram, etc.), and how many trips it contains. This is your starting point for understanding what the feed describes.
Use the Inspector
The Inspector is one of TransitLens's most powerful features. It provides a detailed, structured view of a route's operation, going beyond what you see on the map.
How to use the Inspector
- Select a route: click any route on the map or search its name or number using the top search window
- Open the Inspector: activate the Inspector view from the route's info card
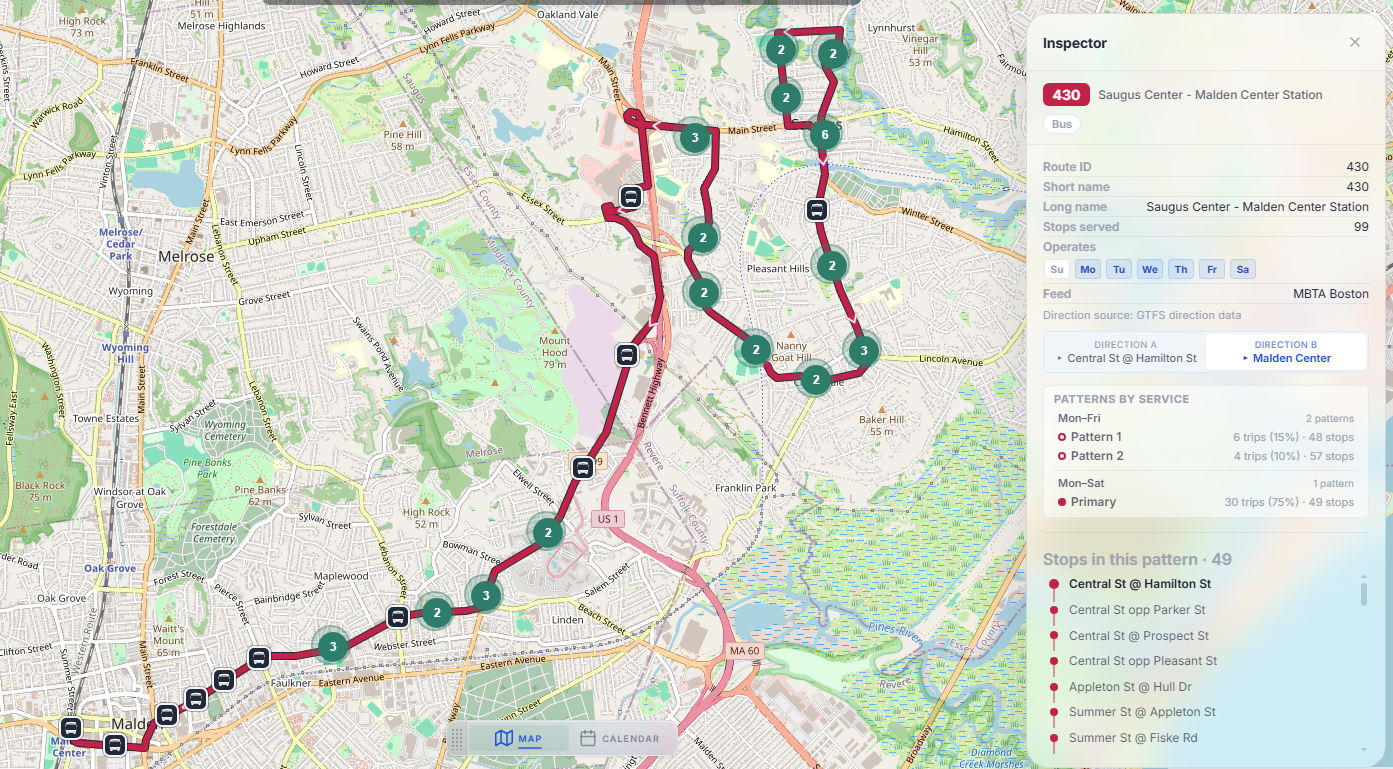
- Explore the details: the Inspector shows the route's data, directions, trip patterns and stop sequences, across service operational week.
The Inspector lets you answer questions like: How many patterns does this route operate? What stops does it serve in each pattern and direction? How does service frequency change throughout the week?
To exit the Inspector, close the panel. The map returns to its normal view.
Understand routes, directions, and patterns
GTFS data has a specific hierarchy that TransitLens makes visible:
- Route: a named transit service (e.g., "Route 38, Geary"). Defined in routes.txt.
- Direction: most routes operate in two directions (outbound and inbound). Each direction has its own set of trips.
- Pattern: a unique sequence of stops within a direction. A single direction can have multiple patterns. For example, a route might have express trips that skip certain stops and local trips that serve all stops.
Understanding this hierarchy is important because it determines what you see when you inspect a route. TransitLens groups trips by direction and pattern, so you can compare service variants side by side.
For a deeper look at how routes, trips, and stops relate in the GTFS spec, see How to Read GTFS Data.
Use filters to analyze the network
Filters let you reduce what's visible on the map so you can focus on specific subsets of the network. TransitLens supports filtering by:
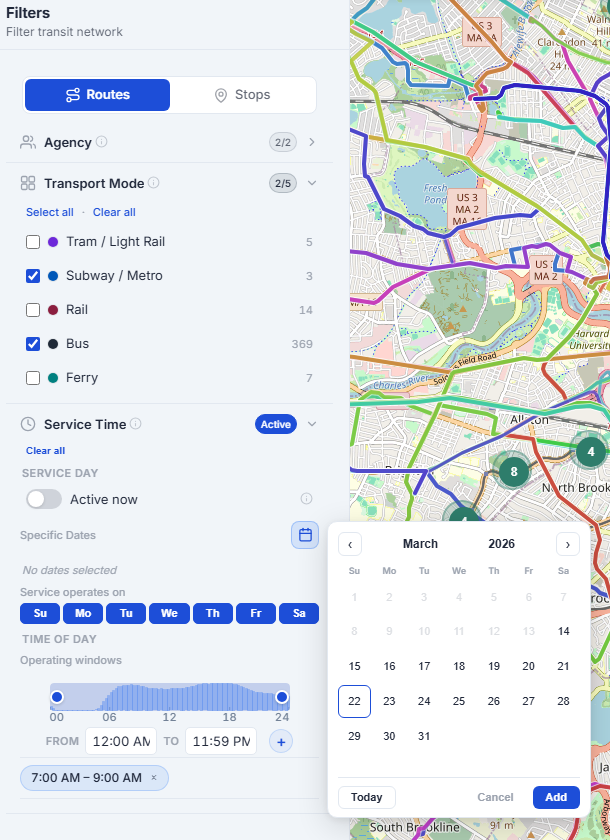
- Route type: show only bus routes, only rail, only tram, etc.
- Time of day: view which routes operate during a specific time window
- Service day: compare weekday vs. weekend vs. holiday service
- Custom boundaries: import a GeoJSON or KML file to overlay zones, districts, or service areas on the map
Practical use cases
- Show only bus routes: filter by route type to isolate bus service and assess coverage without rail or ferry routes cluttering the map
- View service at a specific time: set a time filter to 7:00 to 9:00 AM to see the morning peak network
- Analyze peak vs. off-peak: compare a morning rush filter with a midday filter to see how the network contracts outside peak hours
Filters are cumulative: you can combine route type and time filters to get very specific views. For example, "all bus routes operating between 6 PM and midnight on Saturdays."
Layers vs Filters
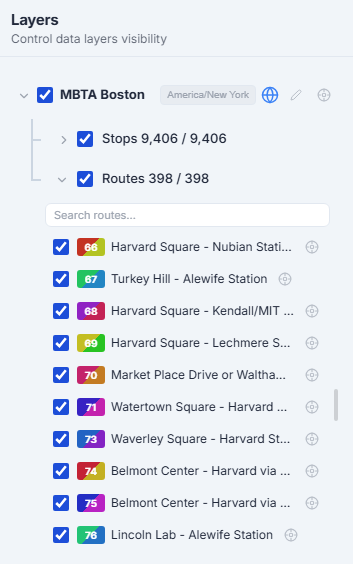
This distinction matters. If you're trying to understand "which routes or stops exist in this area", use layers. If you're trying to see the same data from a different angle, for example what bus routes operate between 7 AM to 9 AM instead of plain route lines, use filters.
Work with live data (GTFS Realtime)
A static GTFS feed describes what is planned. Many agencies also publish GTFS Realtime, a companion data source that describes what is happening right now. It comes in three parts, and each one answers a different question:
- Vehicle positions: where is every active vehicle at this moment? Vehicles appear on the map and move along their routes. Click one to see its heading, its next stop, and occupancy when the agency publishes it.
- Trip updates: is service running on time? Predicted arrivals and departures replace the printed schedule, so the departure boards in the route and stop inspectors shift as trips run early or late. Cancelled trips are counted separately instead of silently disappearing.
- Service alerts: what is disrupted? Detours and disruptions arrive as readable notices, parsed down to the exact routes and stops they affect.
How live data works in TransitLens
There is nothing to configure for supported feeds. When you import a feed from the public catalog and the agency publishes GTFS Realtime, TransitLens detects the endpoints and attaches them automatically. You will know it worked when a green LIVE badge appears in the top bar, together with a live vehicle counter and an alert counter.
- Check what is live. Click the live counter in the top bar to open the realtime status panel. It lists each connected feed and how many vehicles, trip updates, and alerts it is currently receiving. Data refreshes automatically every few seconds.
- Watch the map. Vehicles render on their routes with headings. Click any vehicle for its details, or use its popup to jump straight into the Route Inspector for the route it is serving.
- Read live tables and inspectors. The Routes table gains a realtime column with a live vehicle count and alert badge per route, and both inspectors show whether upcoming departures are on time.
- Review alerts. The alert counter opens the service alerts panel, where each notice lists the affected routes and stops as chips you can follow.
Not every feed has live data. If a feed is static only, TransitLens simply shows the scheduled service, and everything else in this guide works the same way. In the catalog you can tick "Realtime data feeds only" to browse feeds that publish live data.
Common workflows
Here are practical workflows you can follow in TransitLens:
Understand how a route operates across the day
- Select the route from the route list in layers, top search bar or directly on the map
- Open the Inspector by clicking on "View in Inspector" to see all directions, patterns and stop sequences
- Review trip counts and timing to see how frequency changes from early morning to late night
Find all routes serving a specific area
- Zoom into the area of interest on the map
- Click on individual stops to see which routes serve them
- Use route type filters to compare bus vs. rail coverage in that area
Inspect routes or stops in the data table
- Switch to the Routes or Stops table view from the main navigation
- Use the search field to find a specific route or stop by name or ID
- Sort by any column, such as name, type, agency, or zone, to scan the full dataset
- Click any row to jump directly to that route or stop on the map
Compare service between weekdays and weekends
- Set the service day filter to a weekday, and note the network density and route count
- Switch to a Saturday or Sunday filter
- Compare which routes disappear and how frequency changes across the network
- You can also use "Service Rhythm" report from the Insights section