
Turn any GTFS feed into a living map
Open a feed and watch the whole network come to life. Understand routes, schedules and service in minutes, follow vehicles live on supported feeds, and catch problems before riders do.
No scripts, no GIS project, no waiting
Any GTFS feed opens right in your browser and everything is processed on your device. Explore a public network, check a colleague's link, or work on a private draft that never gets uploaded anywhere.
Explore hundreds of public networks
Spin the globe and pick a feed by country, agency or city. You see what each feed supports, including live data, before you even open it.
Open a feed from any link
Paste a feed URL and the network opens ready to explore. Bookmark it, or send the link to a colleague so they see exactly what you see.
Keep private feeds private
Working on an unpublished draft? Drop the ZIP straight from your machine. It is parsed locally and never leaves your browser.
Sample: MBTA data under the MassDOT Developers License Agreement. TransitLens is not affiliated with or endorsed by MBTA. Data licensing
Every question about a feed has a view
Where does the network go? What runs today, and when are the peaks? How does service change through the year? Switch between map, tables, timeline and calendar without losing your place.
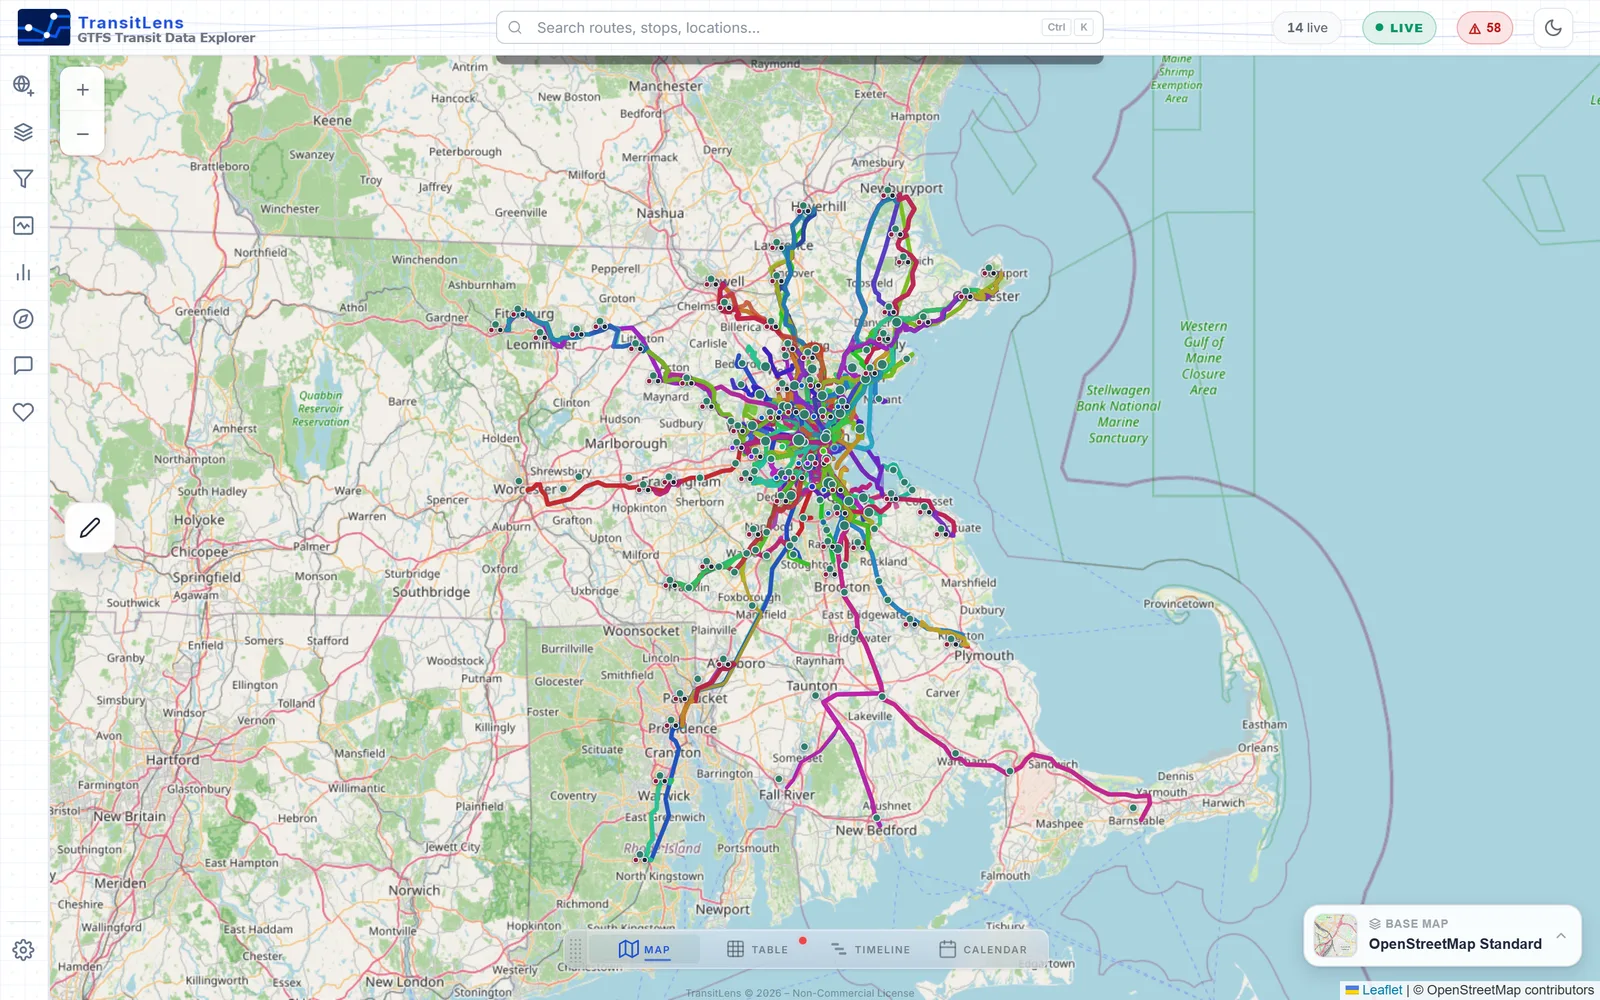
Know where the network goes
The whole system appears on one map, drawn in the agency's own route colors with real shape geometry. Zoom from the full network down to a single platform, and click anything to learn more about it.
- Routes and stops stay readable at any zoom
- Focus on one mode, agency, route or time of day
- Draw an area to study just that part of the city
Find any route, stop or trip in seconds
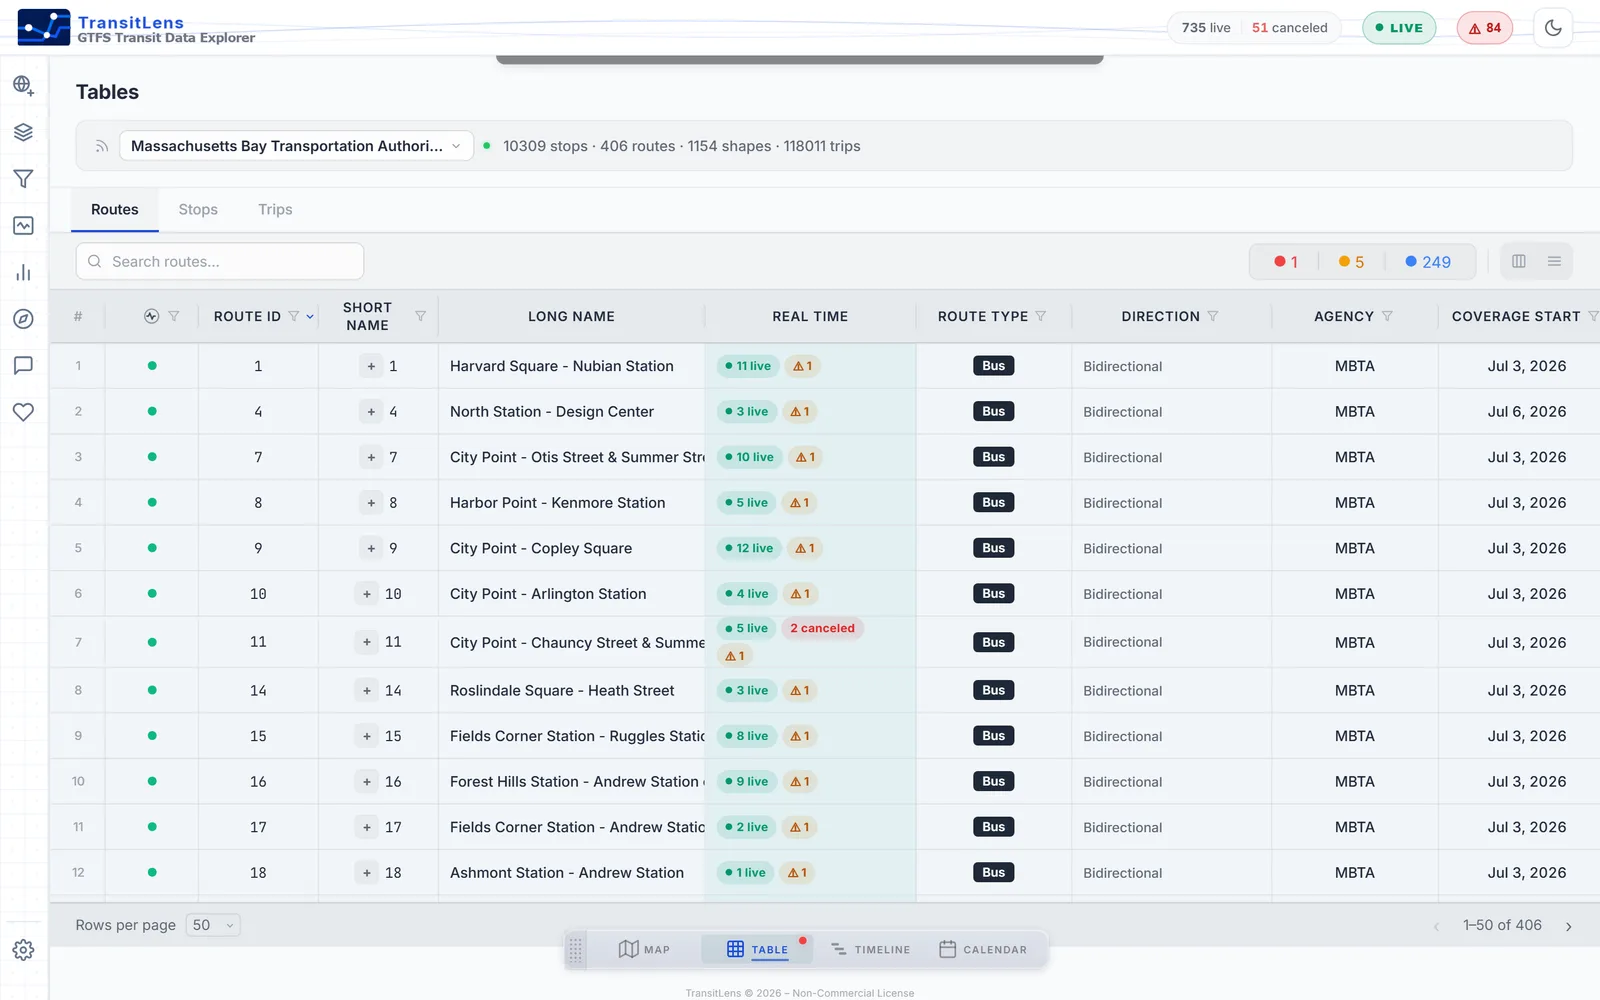
When you need specifics instead of shapes, the same feed becomes clean, sortable tables. Filter to what matters, read coverage dates and route types at a glance, and jump from any row straight to the map.
- Routes, stops and trips in linked tables
- Live vehicle counts and alerts next to each route
- One click locates any row on the map
See when service actually runs
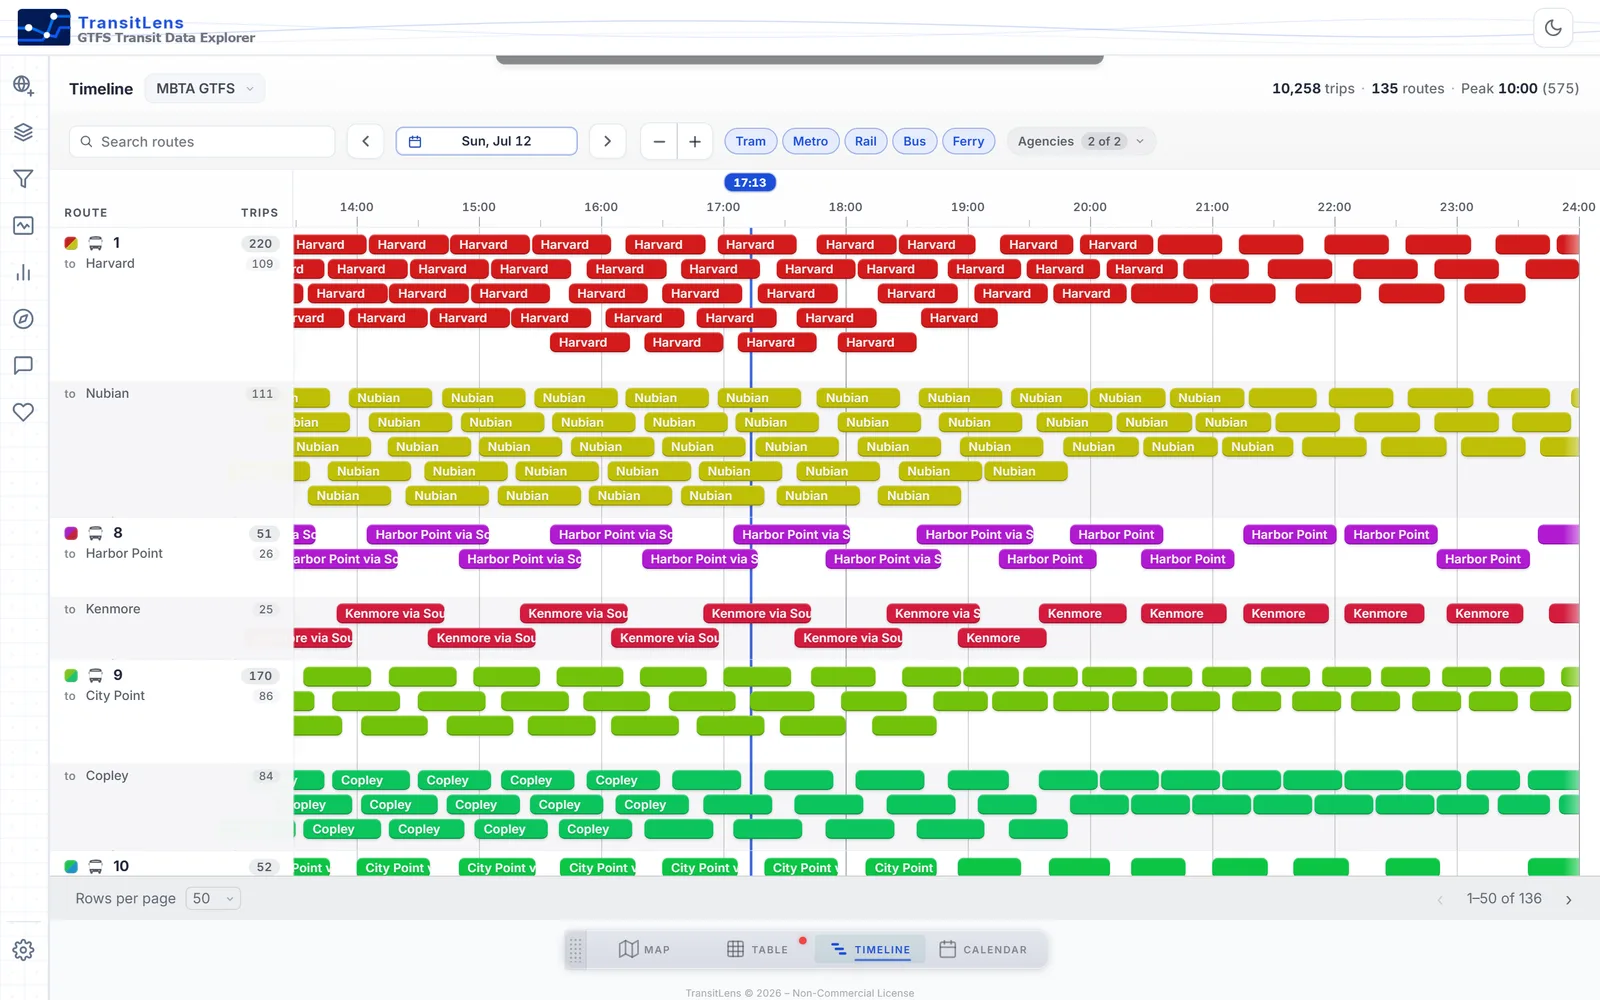
Every trip is laid out across the day, route by route and direction by direction. Morning and evening peaks jump out, and so do the gaps. Pick any service date to see how weekdays differ from weekends.
- The full service day as a trip by trip timeline
- Peak hours detected for you
- Compare directions, modes and agencies
Understand the whole year at a glance
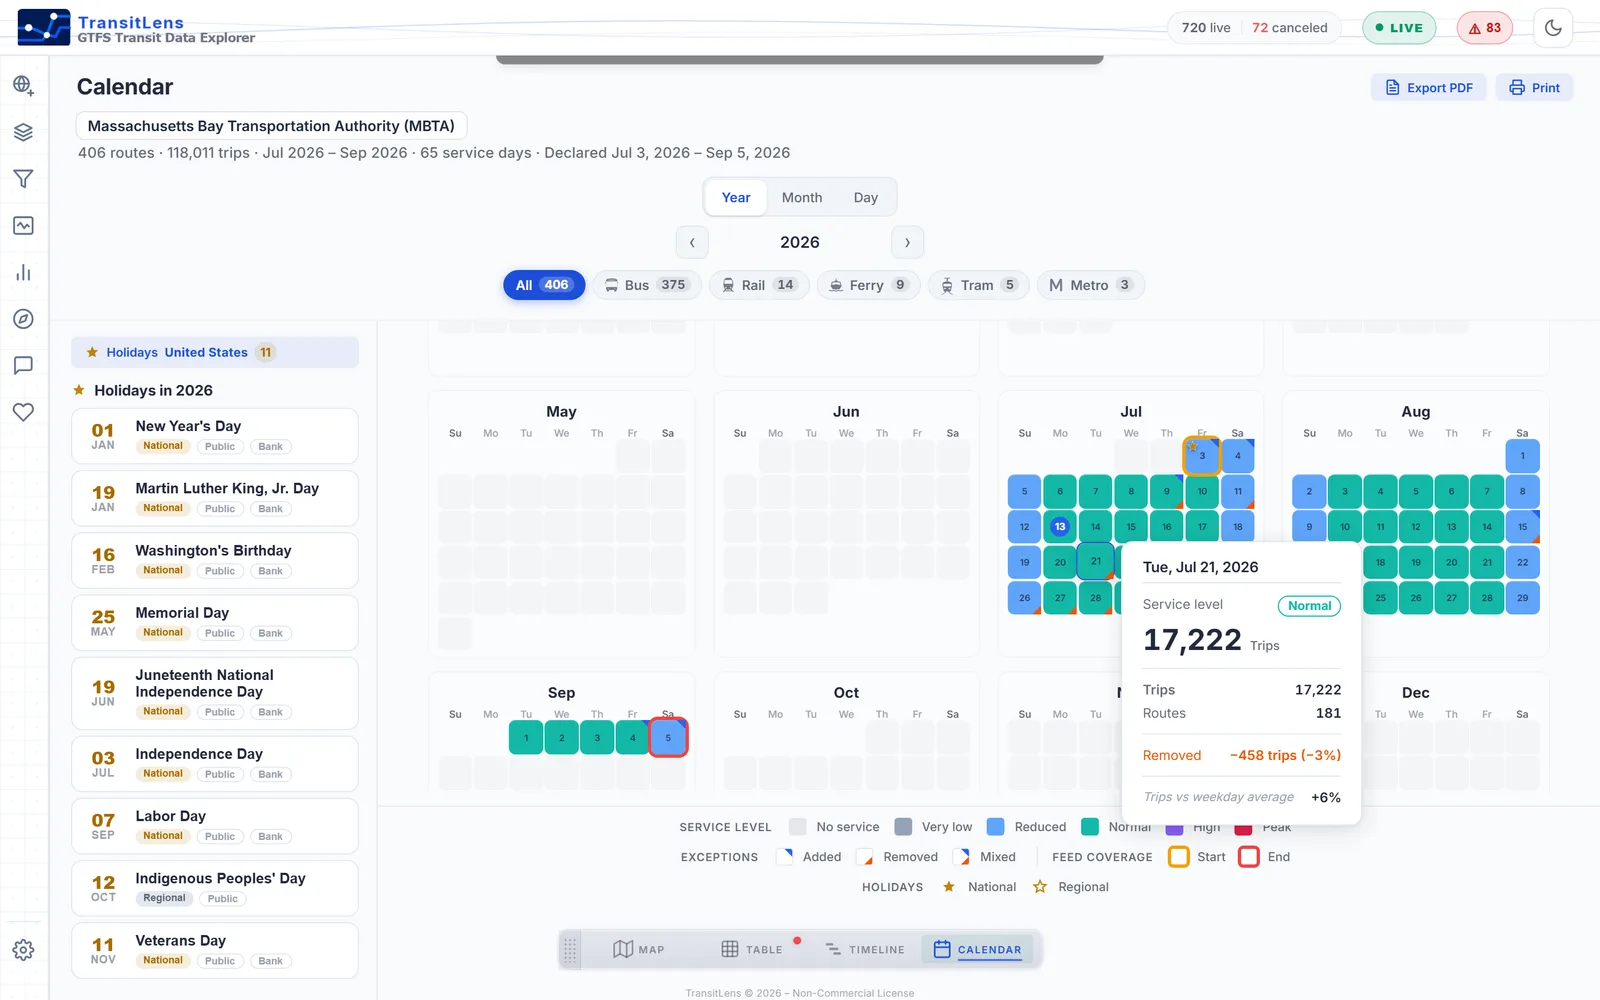
A heat calendar colors every day by how much service runs, so seasonal cuts, holiday schedules and exception days stand out immediately. When someone asks what changed in August, the answer is one screen and one PDF export away.
- Service levels by day, month or year
- Holidays and calendar exceptions marked on the grid
- Export to PDF or print for meetings
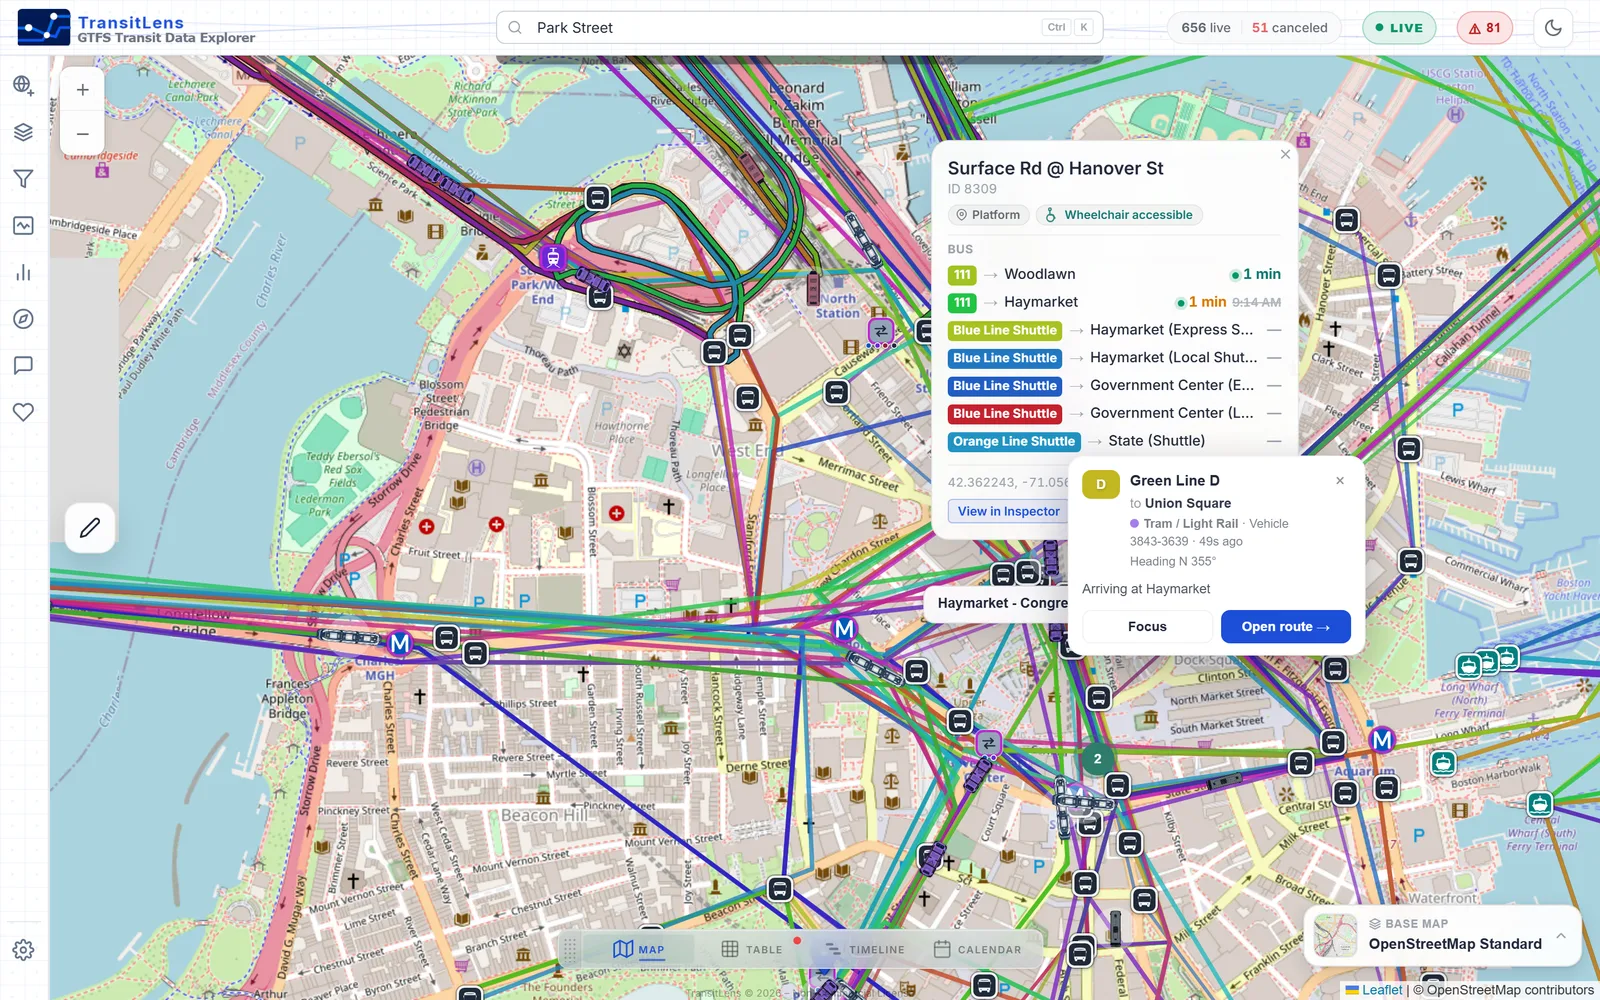
Watch the network run in real time
When an agency publishes GTFS Realtime, TransitLens finds it automatically and brings the map to life. No keys to configure and nothing to set up.
- Live vehicle locations. Every active vehicle moves along its route, with occupancy, heading and the next stop one click away.
- Trip updates. Departure boards shift as service runs early or late, so you can compare what was scheduled with what is really happening.
- Service alert notifications. Detours and disruptions arrive parsed and readable, down to the exact routes and stops they affect.
- Cancellations counted. Cancelled trips are surfaced separately, not silently missing.
Ask detailed questions, get instant answers
Click any route or stop, on the map, in search or in a table, and a focused inspector opens with everything the feed knows about it.
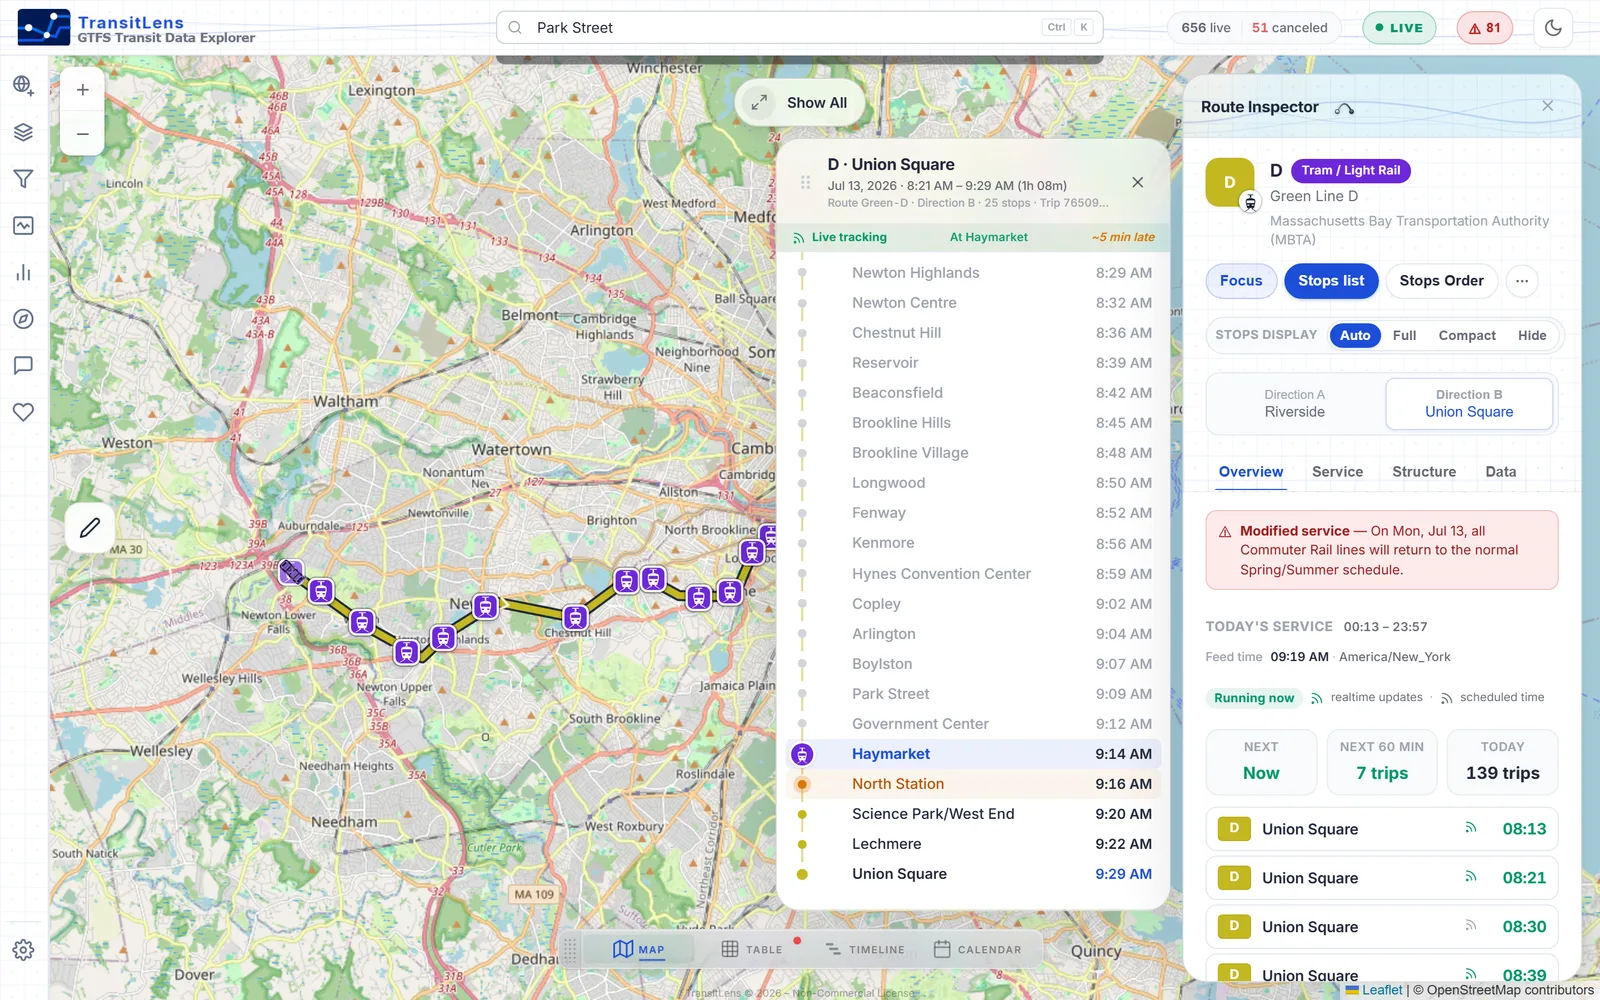
- Today's service window and trip count, live
- Next departures with realtime status
- Every stop in order, with times, per direction
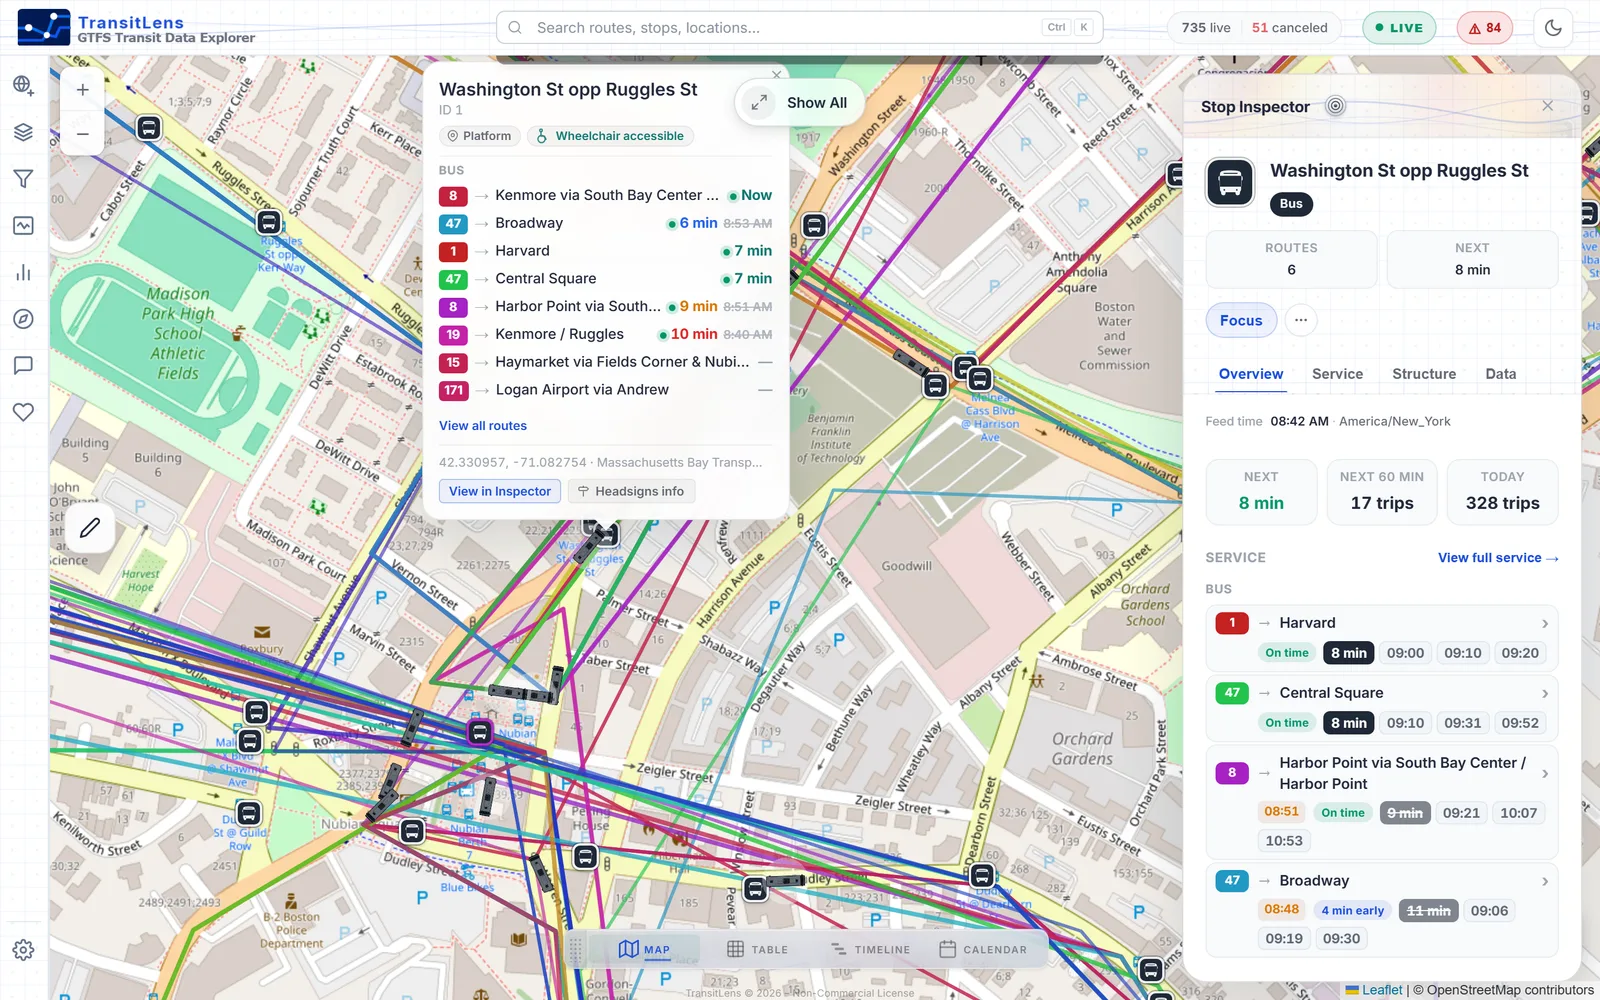
- Every route serving the stop, with next arrivals
- Departures marked on time or delayed as they happen
- Stop ID, platform type and wheelchair access
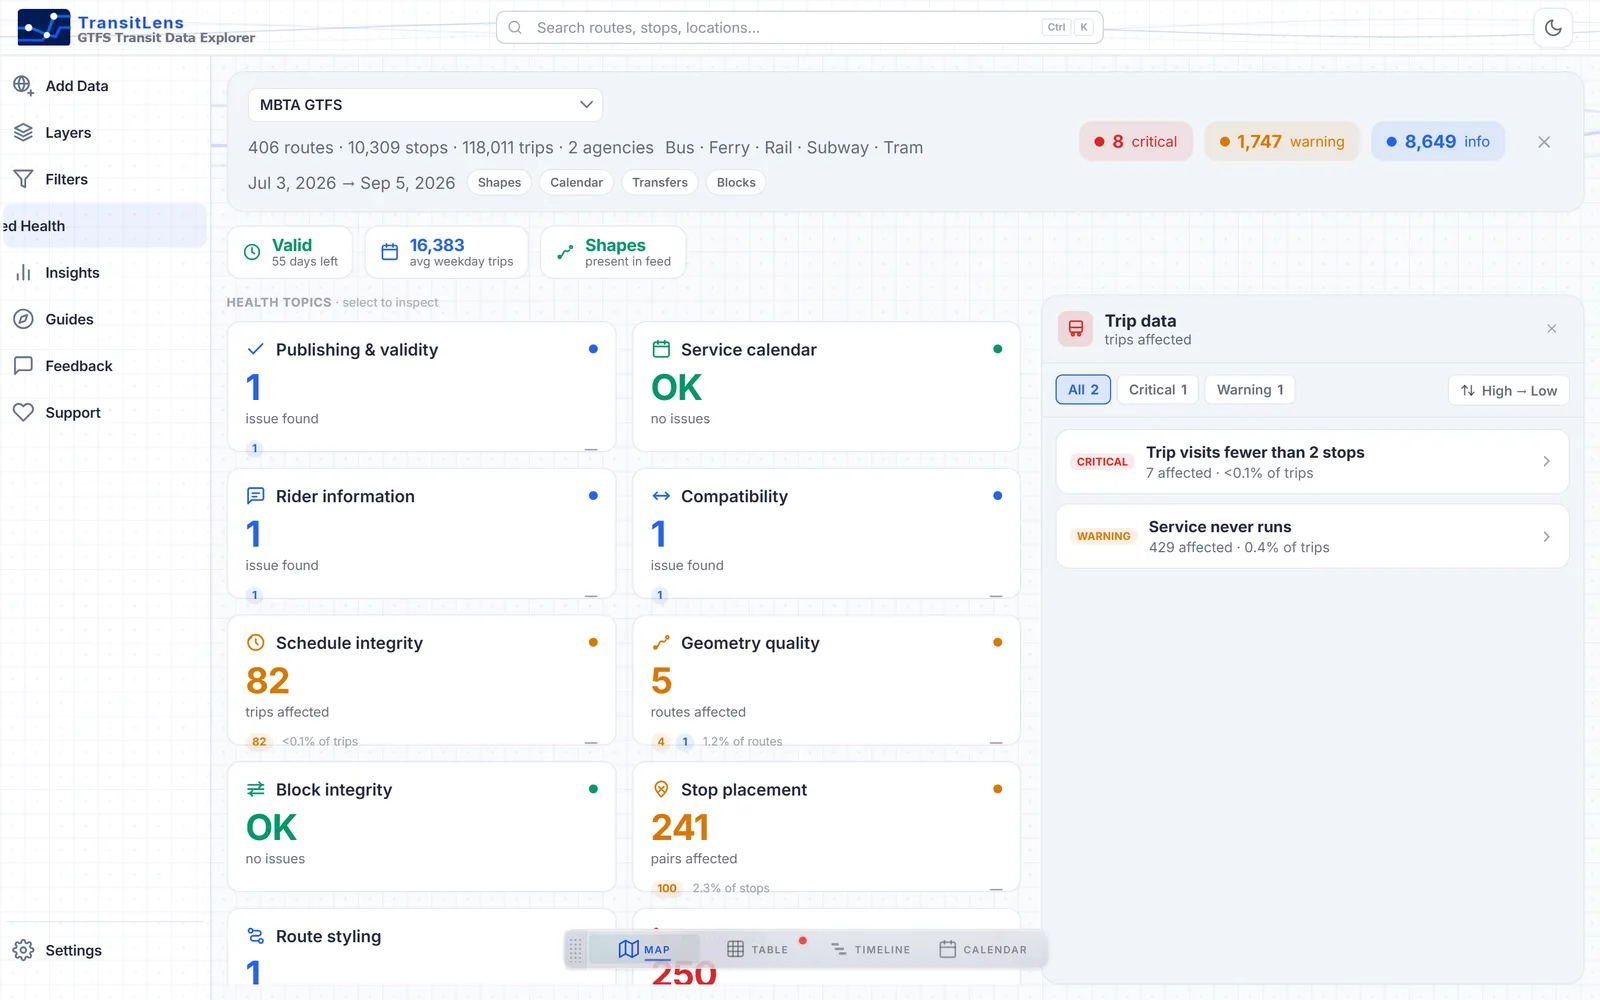
Catch feed problems before your riders do
Publishing a broken feed is expensive. TransitLens checks the whole feed as it loads and sorts every finding by severity, from critical breakage to minor polish, across schedules, geometry, stops, calendars, fares and realtime. Each finding lists the exact routes, stops or trips affected, so fixing it starts immediately.
Turn a feed into something you can present
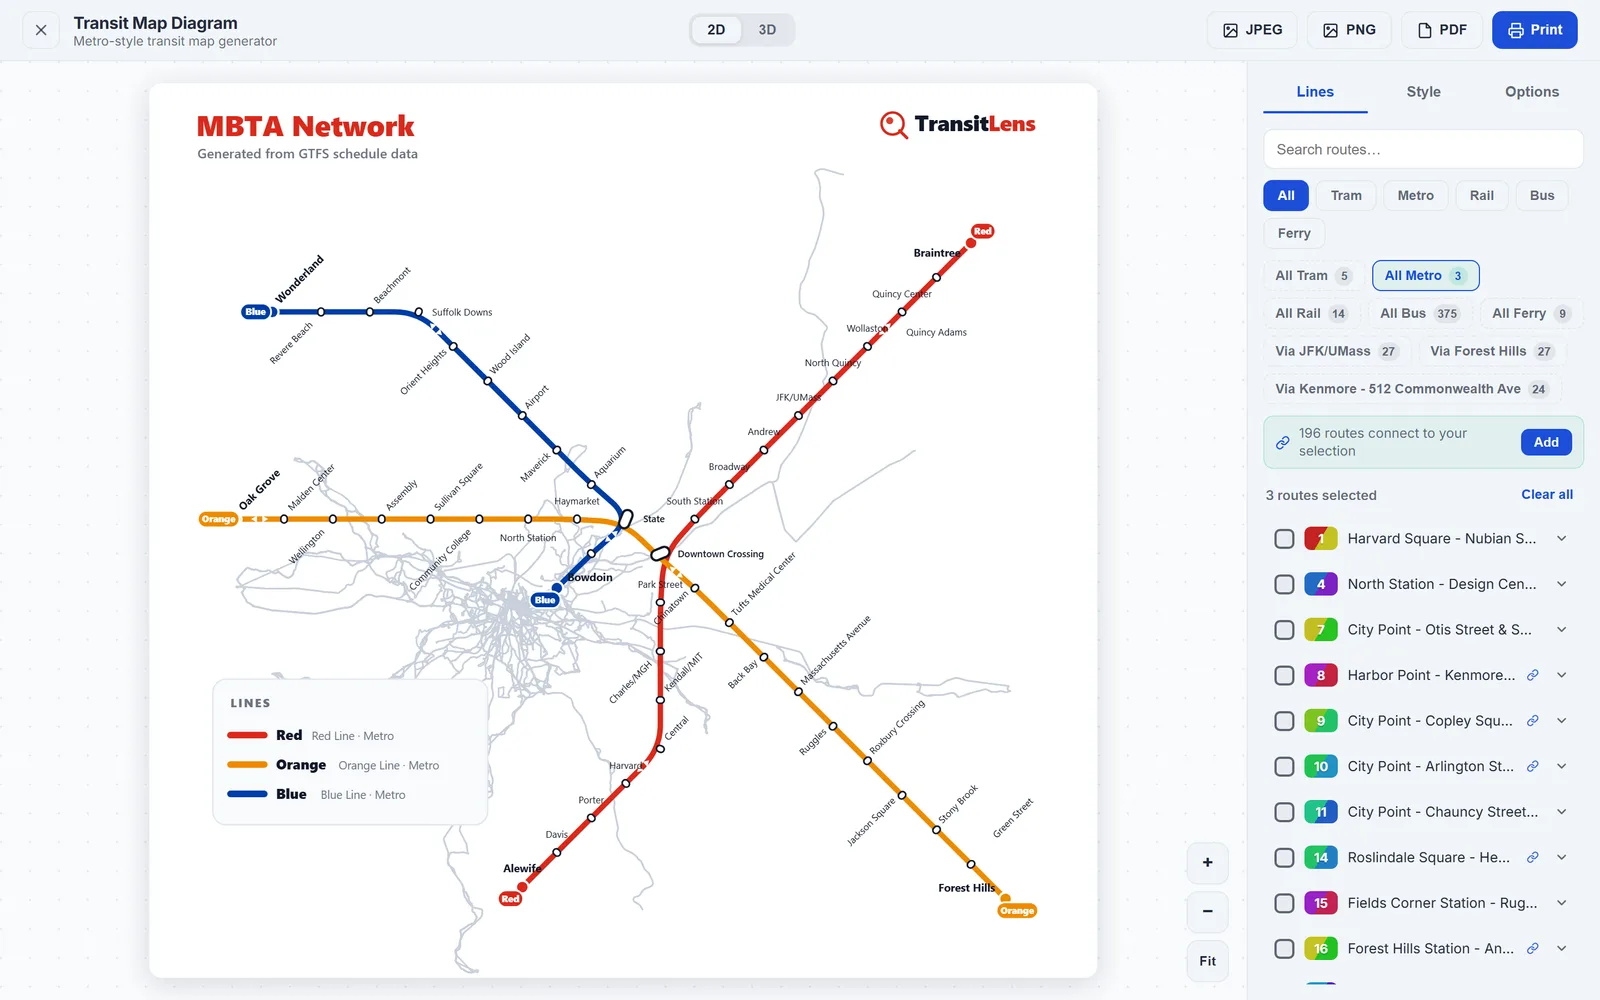
Some questions need more than a map. Built in reports summarize how service behaves, and a diagram generator turns your routes into a schematic you can drop straight into a slide deck.
Service rhythm
How service is distributed across the week.
Service quality
Punctuality and realtime coverage, measured.
Intensity map
Which corridors and stops carry the service.
Map diagram
A metro style schematic, exportable to PNG or PDF.
Made for the people behind the feed
Transit planners
Read network structure, span of service and peaks without exporting anything into a GIS project.
GTFS maintainers
See your feed the way tools and riders will. Validate visually and catch health issues before publishing.
Developers
Understand an unfamiliar feed fast. See how routes, trips, stops and shapes really connect before writing code against them.
Consultants and researchers
Review a new dataset in an afternoon, compare service coverage, and walk away with visuals ready to share.
Agencies and operators
Sanity check schedules and live data, and see the network exactly as your published feed describes it.
Transit enthusiasts
Explore any city's network on a map, follow vehicles live, and learn how GTFS describes the transit around you.
Fast, private and built only for transit data
Nothing to install
Open a browser tab and start exploring. Works the same on any machine.
Your data stays yours
Feeds are parsed on your device. Local files never leave your browser.
Built for big feeds
Hundreds of routes and a hundred thousand trips stay smooth and responsive.
Free to use
Standard GTFS and GTFS Realtime support, free to use.