
GTFS Viewer
Answer any question about a transit feed in minutes. TransitLens opens a GTFS feed right in your browser and turns it into an interactive map, sortable tables, service timelines and calendar heatmaps. Nothing to install, free to use.
Understand a transit network, not a pile of CSV files
A GTFS feed describes an entire network across linked text files: routes, trips, stops, stop times, shapes and calendars. A GTFS viewer joins them for you, so instead of cross referencing IDs you read the network the way it actually runs.
Answer questions in minutes
Where does this route run? What serves this stop? What changes on holidays? Every question has a view, and every view is one click from the next.
See structure, not IDs
Routes are drawn with their real shape geometry, stops sit at their true coordinates, and calendars become pictures. The relationships in the data become visible.
Keep control of your data
Feeds are parsed on your device. Drop a local ZIP and it never leaves your browser, so unpublished drafts stay private while you review them.
New to the format? The How to Read GTFS Data guide explains how the files connect.
Explore the whole feed without leaving your browser
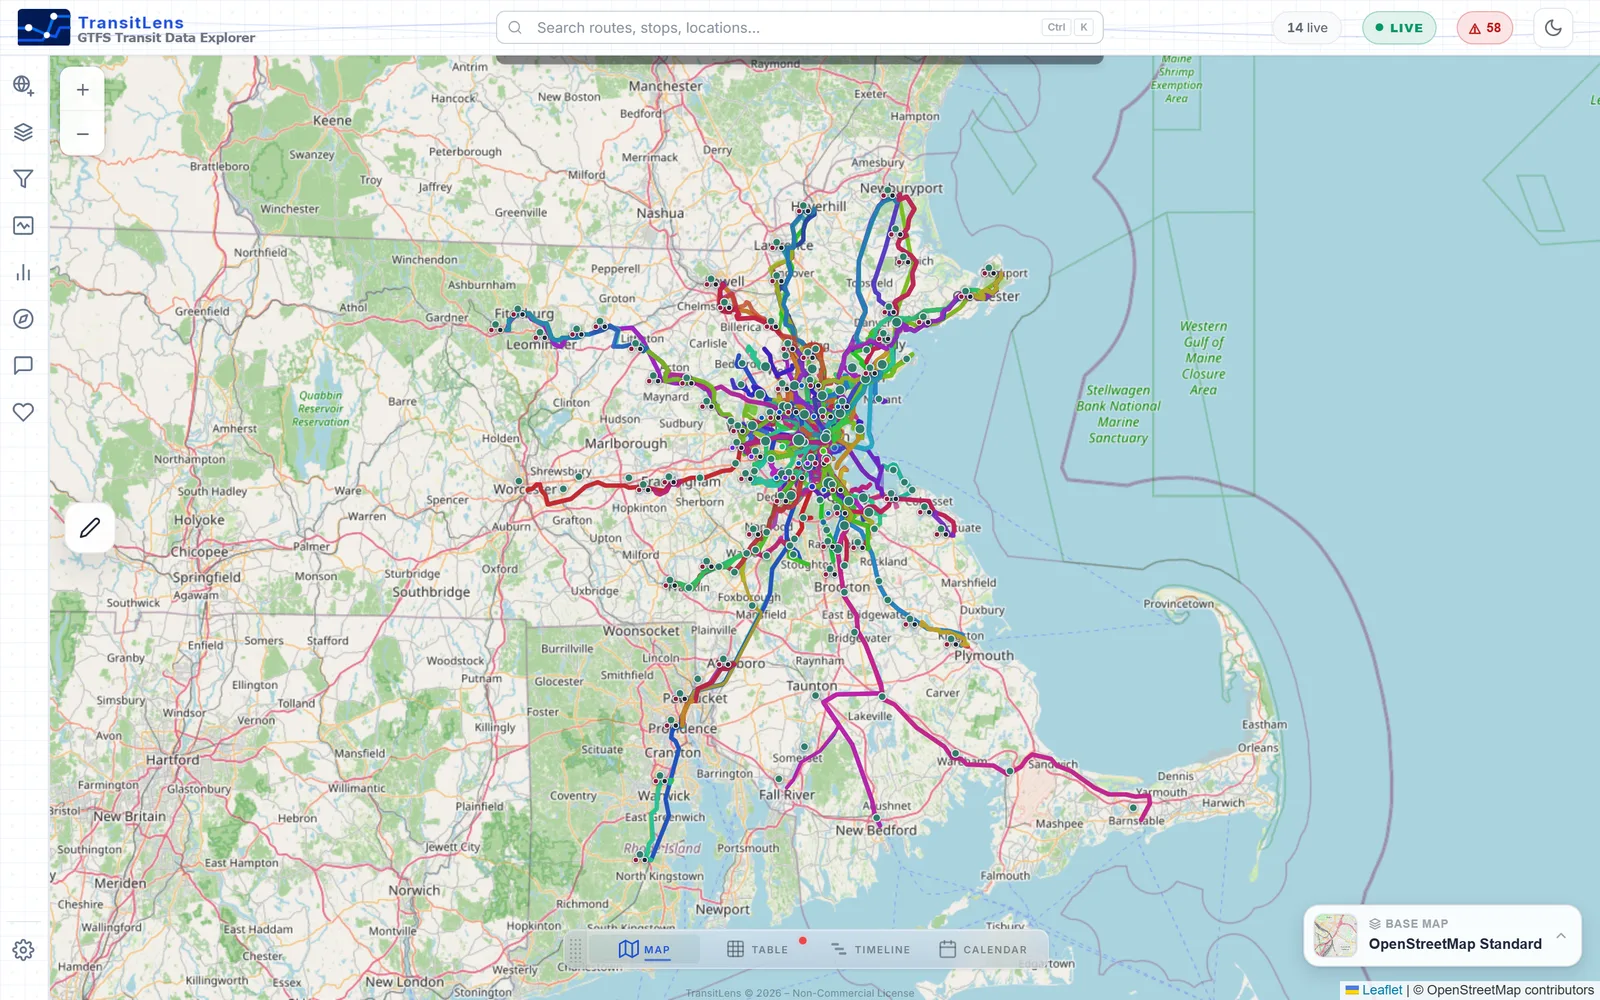
See every route, stop and shape at once
The full network appears on an interactive map, drawn in the agency's own route colors with real geometry from the shapes file. Zoom from a regional overview down to a single platform and click anything to learn more.
- Routes rendered from shape geometry, stops at their true coordinates
- Filter by mode, agency or route to focus on one part of the network
- Click a stop to see which routes serve it
Know exactly how a route runs
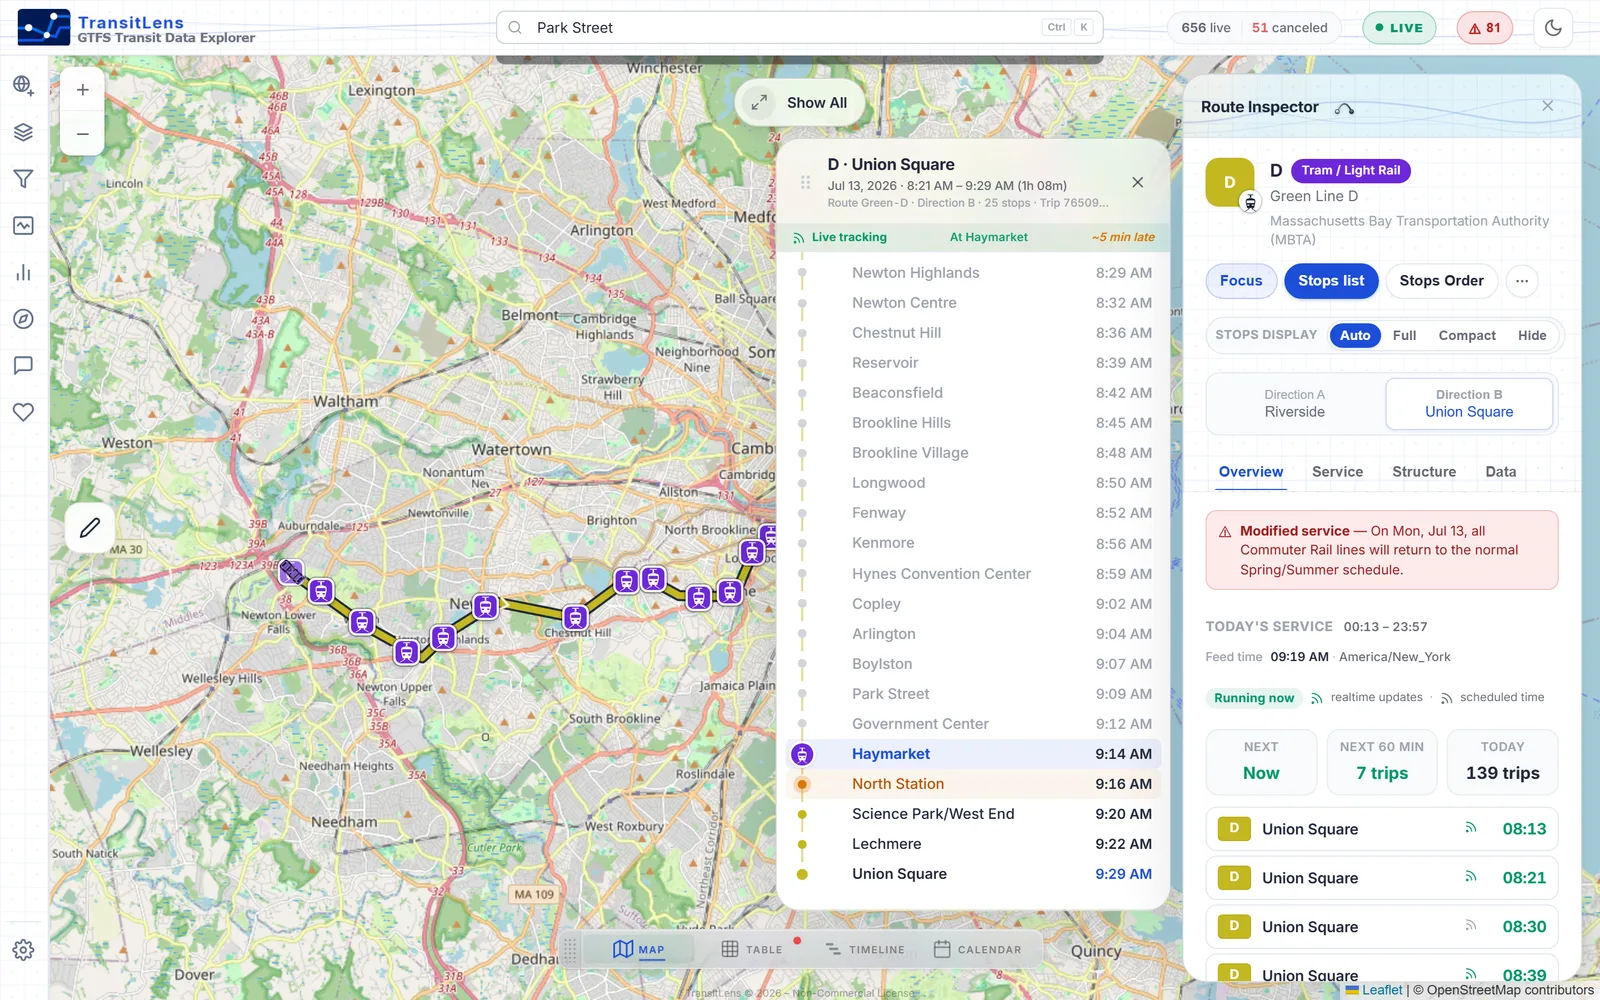
Open any route and a focused inspector answers the detailed questions: which direction, which stops, in what order, and what departs next. It is the fastest way to verify that a route behaves the way the schedule says it should.
- Toggle between directions and compare their stop sequences
- Read upcoming departures and today's service window
- Walk the ordered stop list with times, stop by stop
See how service changes through the year
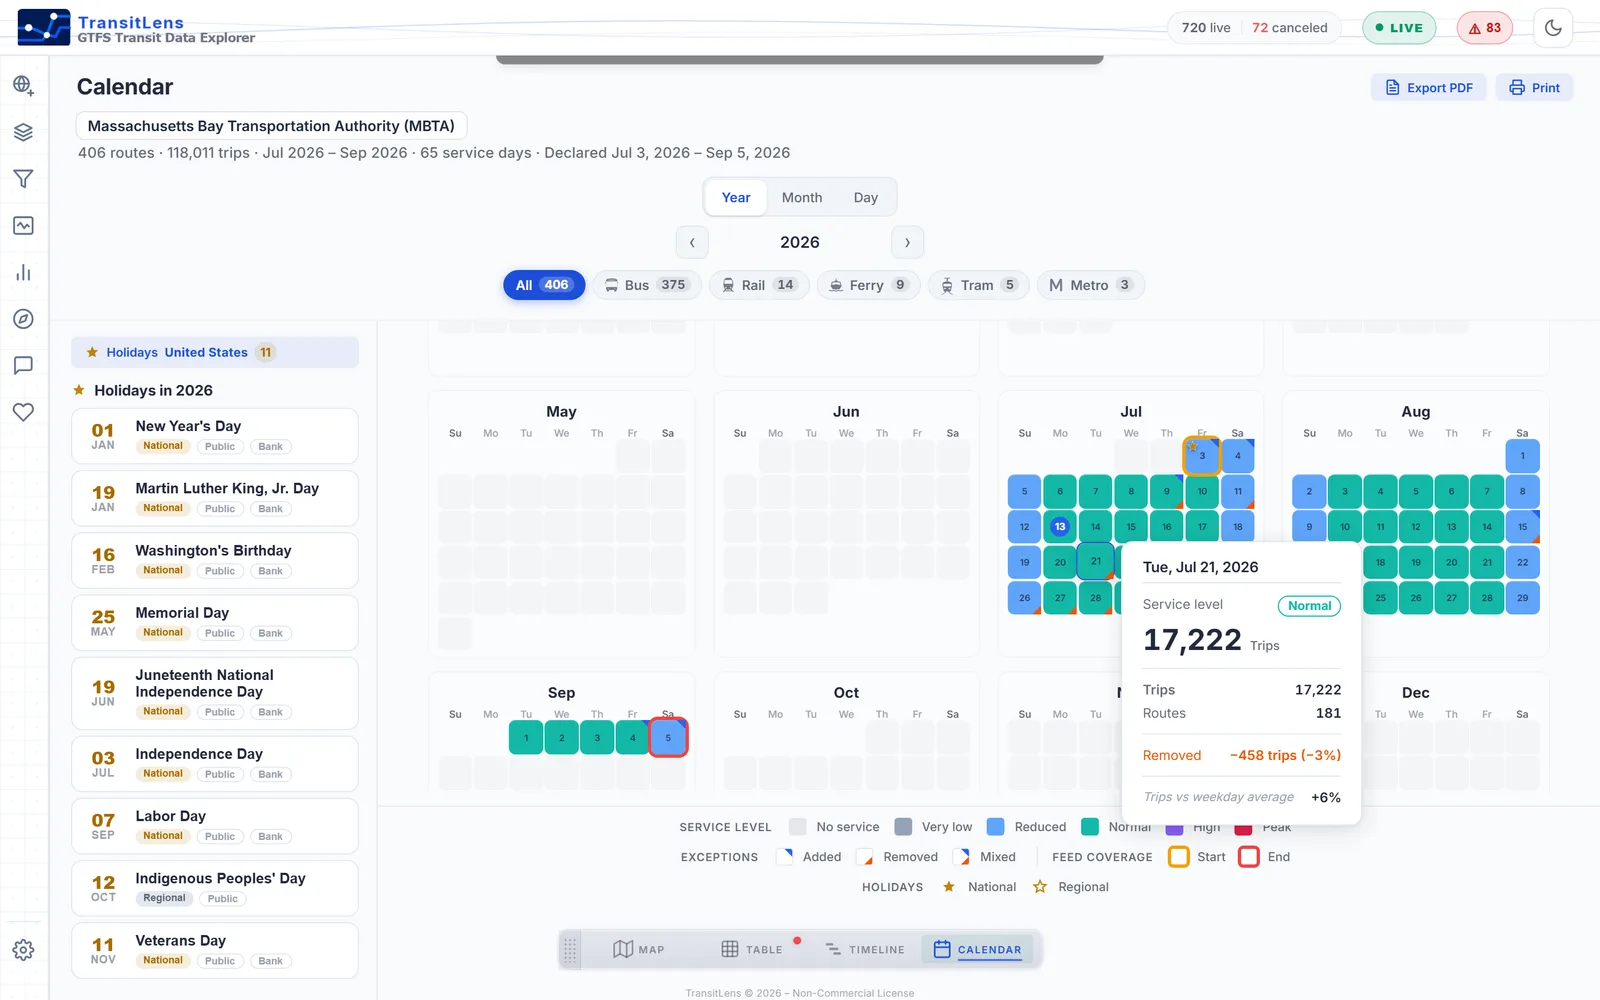
A heat calendar colors every day by how much service runs, so holiday schedules, seasonal cuts and calendar exceptions stand out immediately. A companion timeline lays trips across the day, route by route, with peak hours detected for you.
- Service levels by day, month or year at a glance
- Weekday, weekend and exception patterns side by side
- Trip by trip timelines that make peaks and gaps obvious
Find any record in seconds
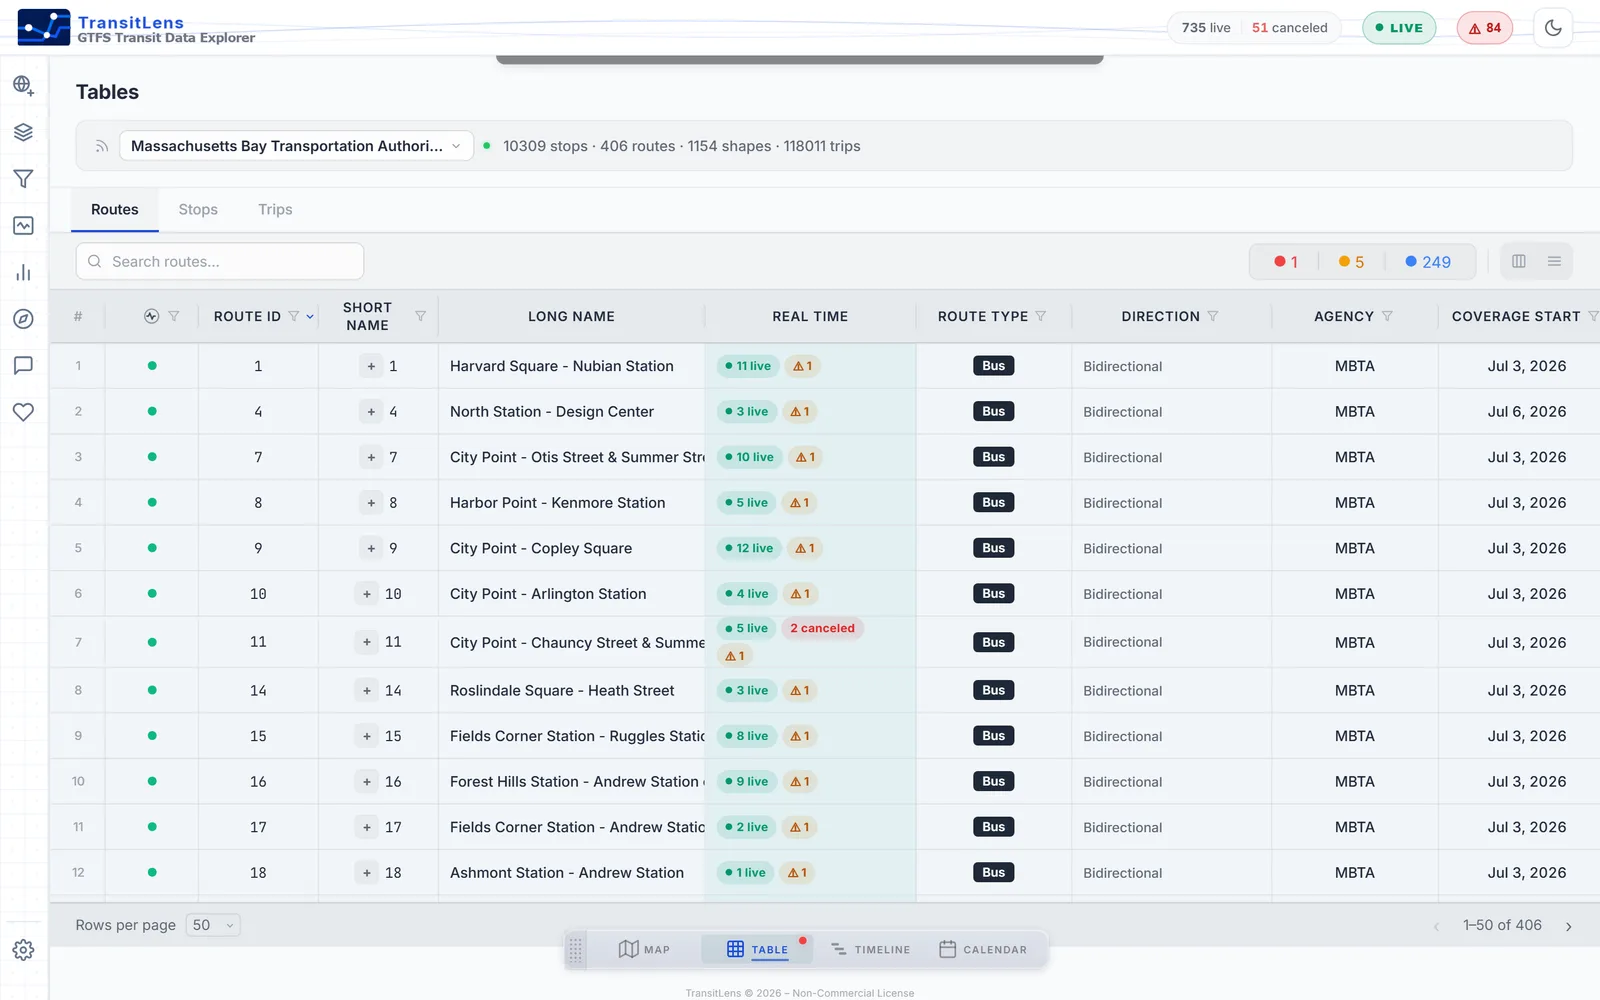
When you need specifics instead of shapes, the same feed becomes clean, sortable tables. Scan hundreds of routes with their agencies, modes and coverage dates, filter to what matters, and jump from any row straight to the map.
- Routes, stops and trips in linked, searchable tables
- Mode badges, coverage dates and realtime availability per route
- One click locates any row on the map
Catch feed problems before you publish
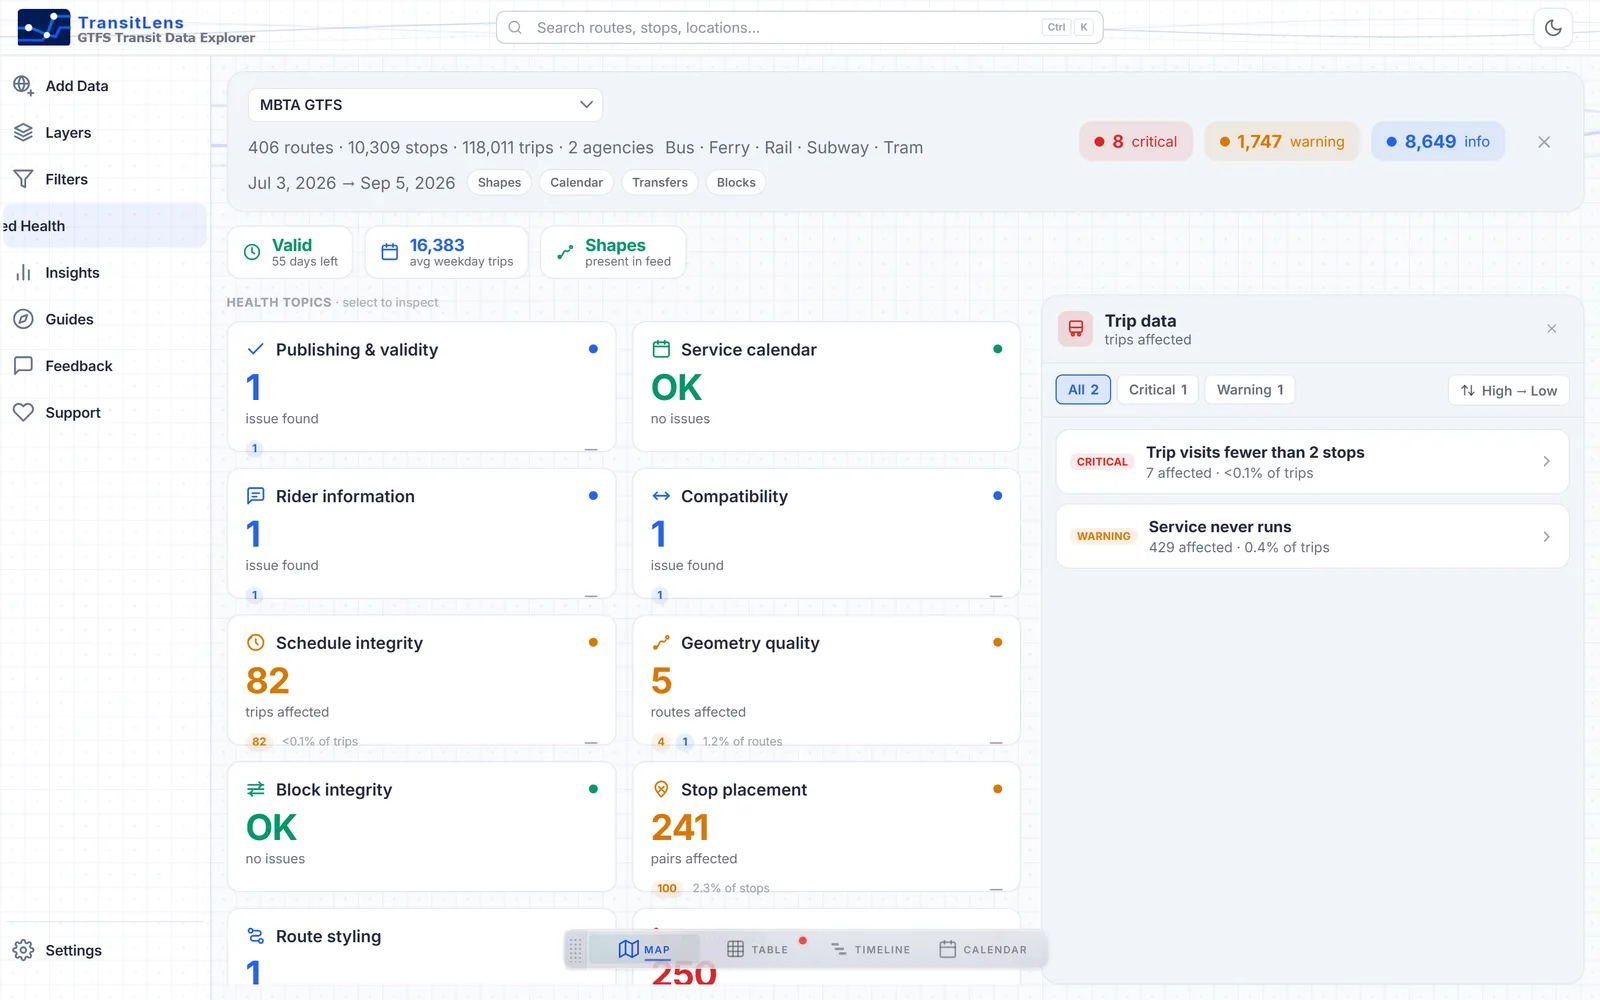
Every feed is checked as it loads. Findings are sorted by severity, from critical breakage to minor polish, across schedules, geometry, stops, calendars, fares and realtime. Each finding names the exact routes, stops or trips affected, so the fix starts immediately instead of with a search.
- Severity categories that separate must fix from nice to fix
- Coverage of schedule, geometry, calendar and fare issues
- Affected entities listed for every finding
How to view a GTFS feed
From a raw ZIP to an explorable network in under a minute.
Get a feed
Download a GTFS ZIP from a transit agency or an open data portal, copy a feed URL, or pick a public network from the built in catalog.
Open it in TransitLens
Drop the file into the app or paste the URL. Everything is parsed locally in your browser, so local files are never uploaded anywhere.
Explore
The network appears on the map, with tables, timelines, calendars and health checks ready in the same workspace.
No feed handy? Open the MBTA Boston feed, or follow the Quick Start Guide for a feature by feature walkthrough.
A GTFS viewer built for real work
Nothing to install
Runs in a browser tab on any machine. No server, no dependencies, no setup.
Private by design
Feeds are processed on your device. Local files never leave your browser.
Handles big feeds
Hundreds of routes and tens of thousands of stops stay smooth to explore.
Free to use
Standard GTFS and GTFS Realtime support, free to use.
Working spatially? The GTFS Map Viewer page covers geographic analysis, network structure and boundary overlays.